Another “Hobbit Year”
We’ve been going down a bit of a rabbit hole – to be fair it is the Easter season! Following up on our recent post about the continuing importance of Boxing Day as a release date in Australia, we went on a chocolate-fuelled dive to look in detail at the cinema calendar.
This isn’t the first time the Kinomatics team has addressed the question of the annual cinema calendar. Way back in 2014 we coined the idea of the “Hobbit Year” as an alternative perspective for analysing film releasing.
What is the Hobbit Year? The Hobbit Year is a way of smoothing some of the volatile peaks and troughs that affect annual summaries of cinema box-office data collection.
The most commonly used annual segmentation in everyday reporting is based on the calendar year – “the top-grossing film of 2025” and so on. However, the importance of the final weeks of December makes this division problematic. As we saw in our previous post, Boxing Day is one of the biggest release dates of the year, but its release earnings will be split between different years if a simple calendar division is used. What’s more, we’ve seen in recent years that some of the biggest films of the year release in the weeks leading up to Christmas, as the Hobbit films did so notably between 2012 and 2014.
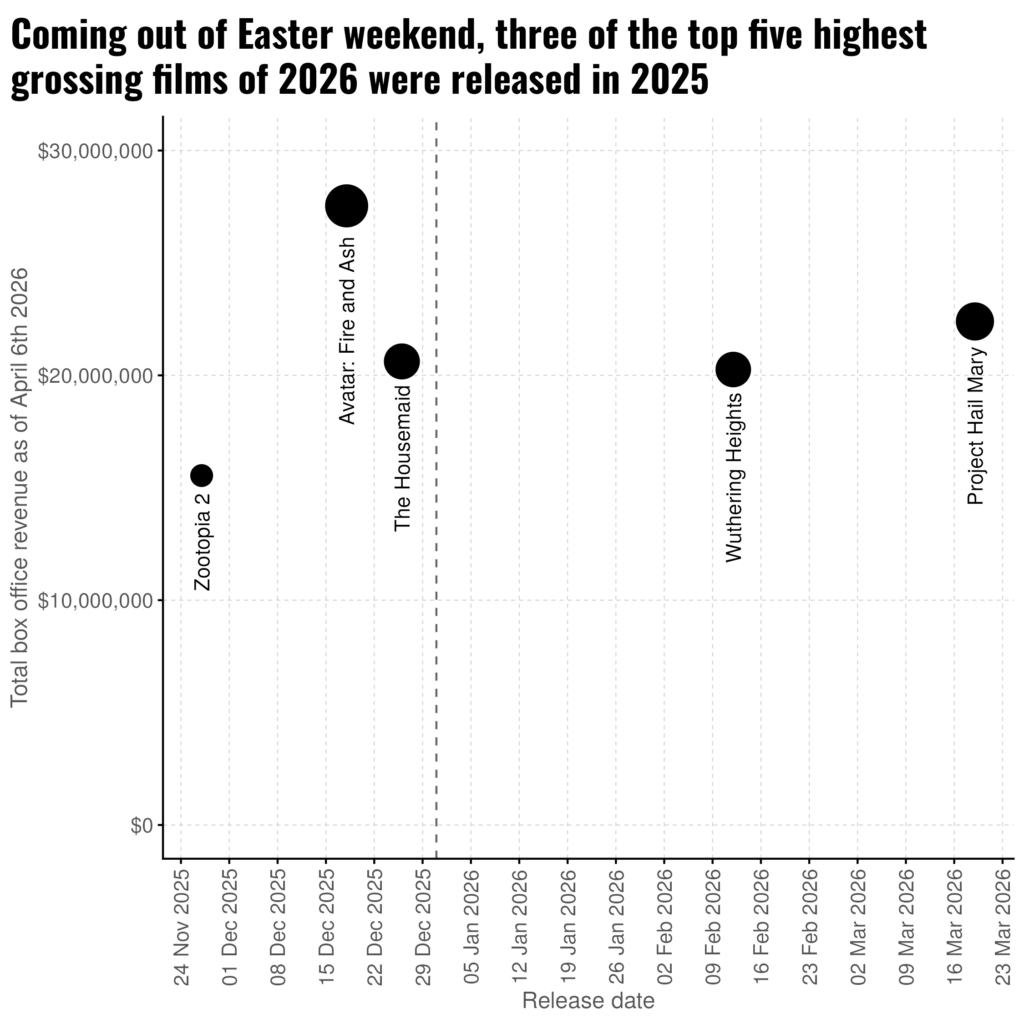
This past season was another good illustration of the problem, with Avatar: Fire and Ash, the year’s biggest film, releasing a week before Christmas. The latest Avatar film has the highest lifetime gross of any film released in 2025, but it’s only the 3rd highest grossing film of 2025 due to its late release slot. Funnily enough, it is the highest grossing film of 2026 so far by a healthy margin. In fact, as Chart 1 shows, as of Easter Monday, three of 2026’s five highest grossing films were actually released in 2025.
Chart 1
What if we shifted to financial year summaries? This is the preferred strategy for Screen Australia which has for years stuck with presenting information in an Australian financial year format (July 1–June 30). However most industry organisations, and most of the media, use the more typical January–December period.
The lack of compatibility between financial and calendar years is a challenge for reconciling government and non-government views of industry data. And the fundamental issue of lumpy box office is still a problem even if we move to financial year accounting because it places the division right in the middle of the U.S. summer blockbuster season when many of the year’s biggest films are released globally – including in Australia.
When are the hits released in Australian cinemas?
Ideally, any annual division would avoid the periods when the top earning films tend to come out. So when might those periods be?
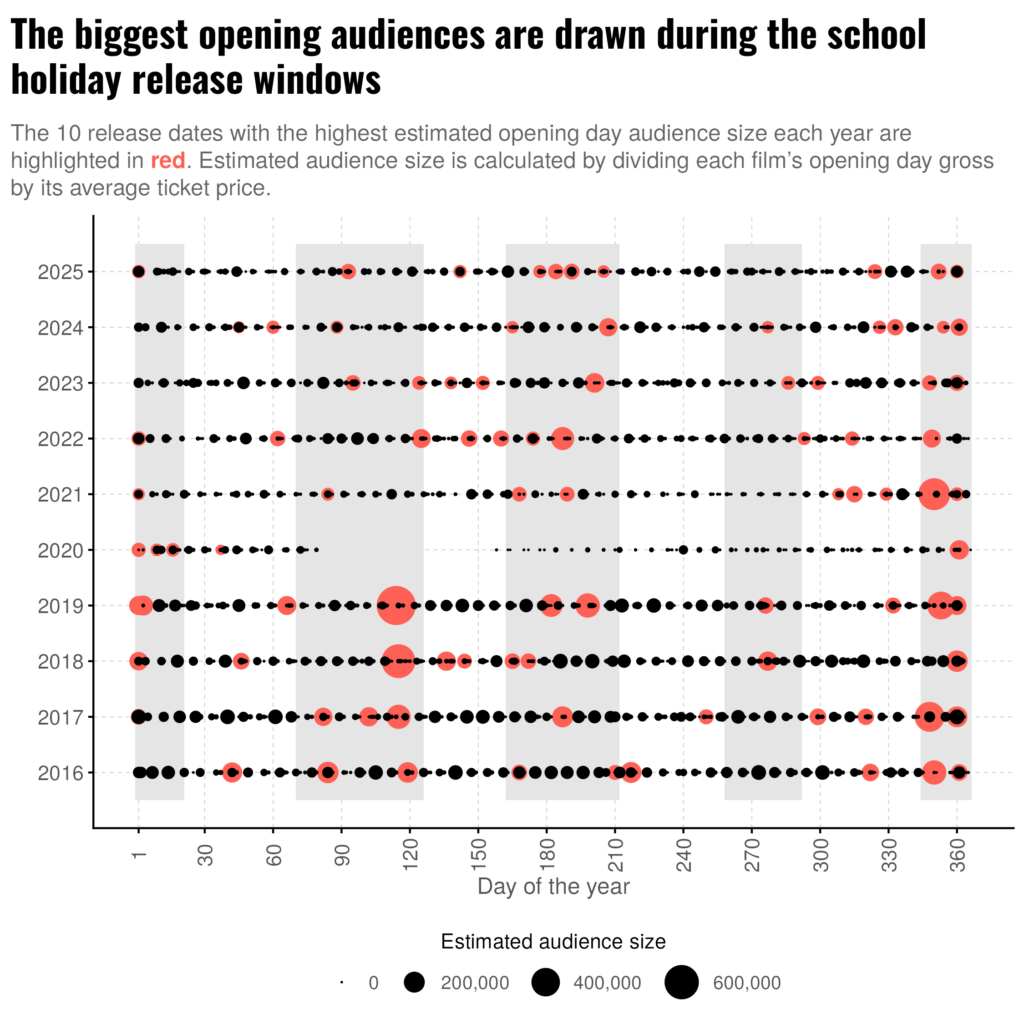
We looked at the release calendar for the last 10 years to see if there are patterns to when the biggest films of the year tend to come out. In the following charts, each release date is a circle, and the bigger the circle, the more money made by the films released on that date. We’ve highlighted the top 10 films each calendar year in red. We’ve also shaded in the four main school holiday periods in Australia, which we’ll come back to later.
Chart 2
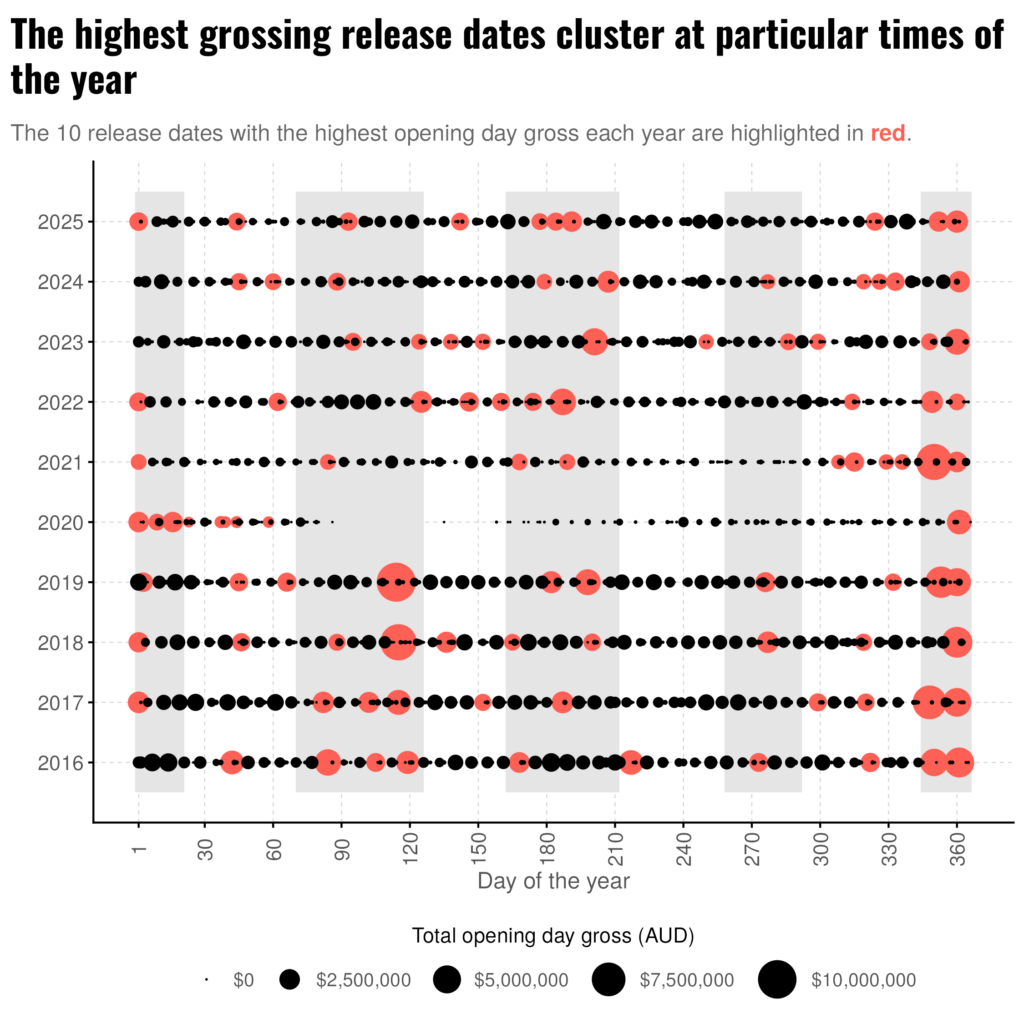
Let’s start with the opening day numbers, shown in Chart 2. The gray areas correspond broadly to school holiday dates (obviously these differ slightly between years and education jurisdictions). We have tried to be as inclusive as possible, so that for a given year and state/territory, the holiday is likely to fall within our window.
What is easily evident here is the way the biggest releases mostly cluster around holidays. There are a couple of interesting exceptions, but they tend to be much smaller release hits than those released during the holidays.
Also easily visible: the red balloons tend to be more evenly sized in recent years. In other words huge opening day breakout hits are less common.
Chart 3
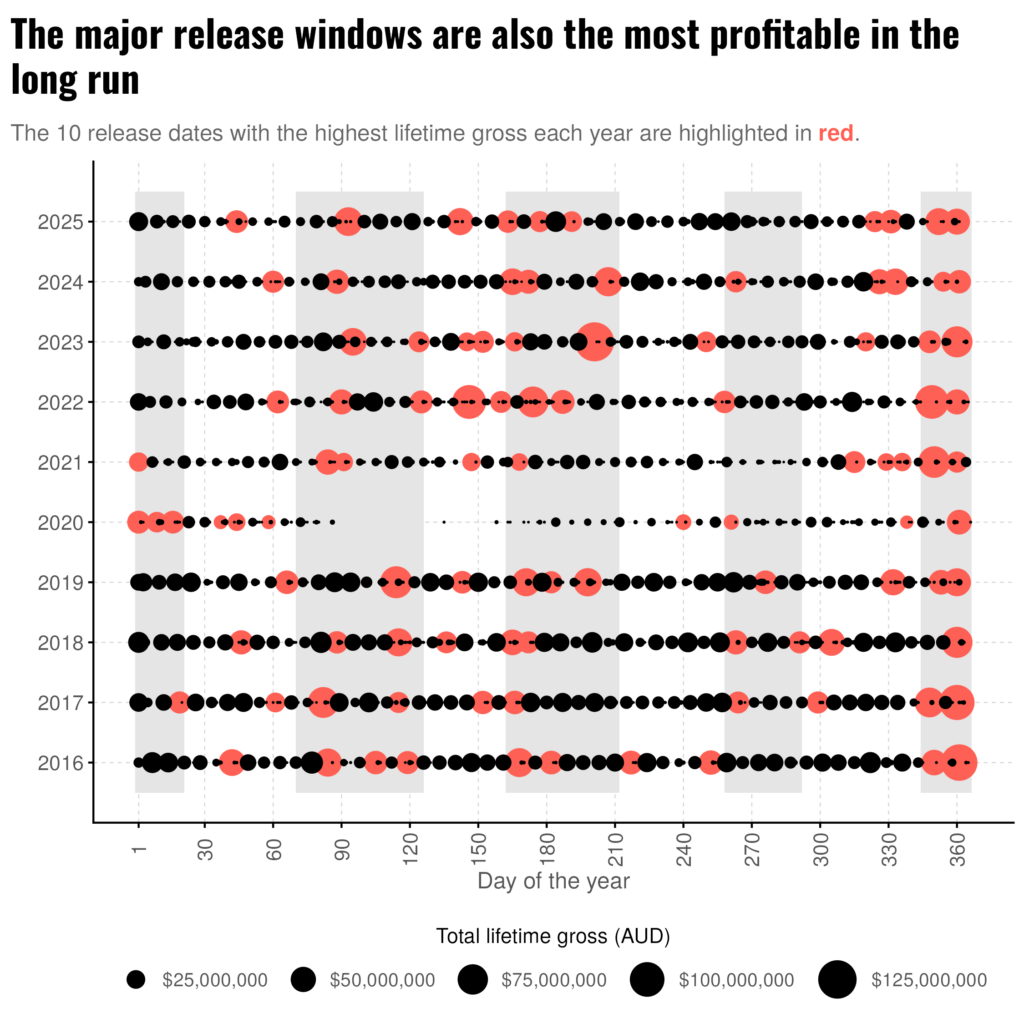
The pattern is even clearer to see in Chart 2, which looks at lifetime gross for each release date’s films. Again, the biggest films each year clearly cluster around Christmas and New Year, the Easter holidays, and the May-July period. We don’t see much of a difference between the dates with the biggest opening films and those with the most lasting success. In other words, hit films released during the holidays also tend to be the most profitable in the long run.
School’s out
So whether we are measuring how much money films earn in their opening days or how much films earn across their entire lifetime, what they have in common is that the highest earners typically get released during school holidays. We can see this more clearly in Chart 3 which shows that the majority of the ten top-grossing films each year are released during the school holiday windows.
Chart 3
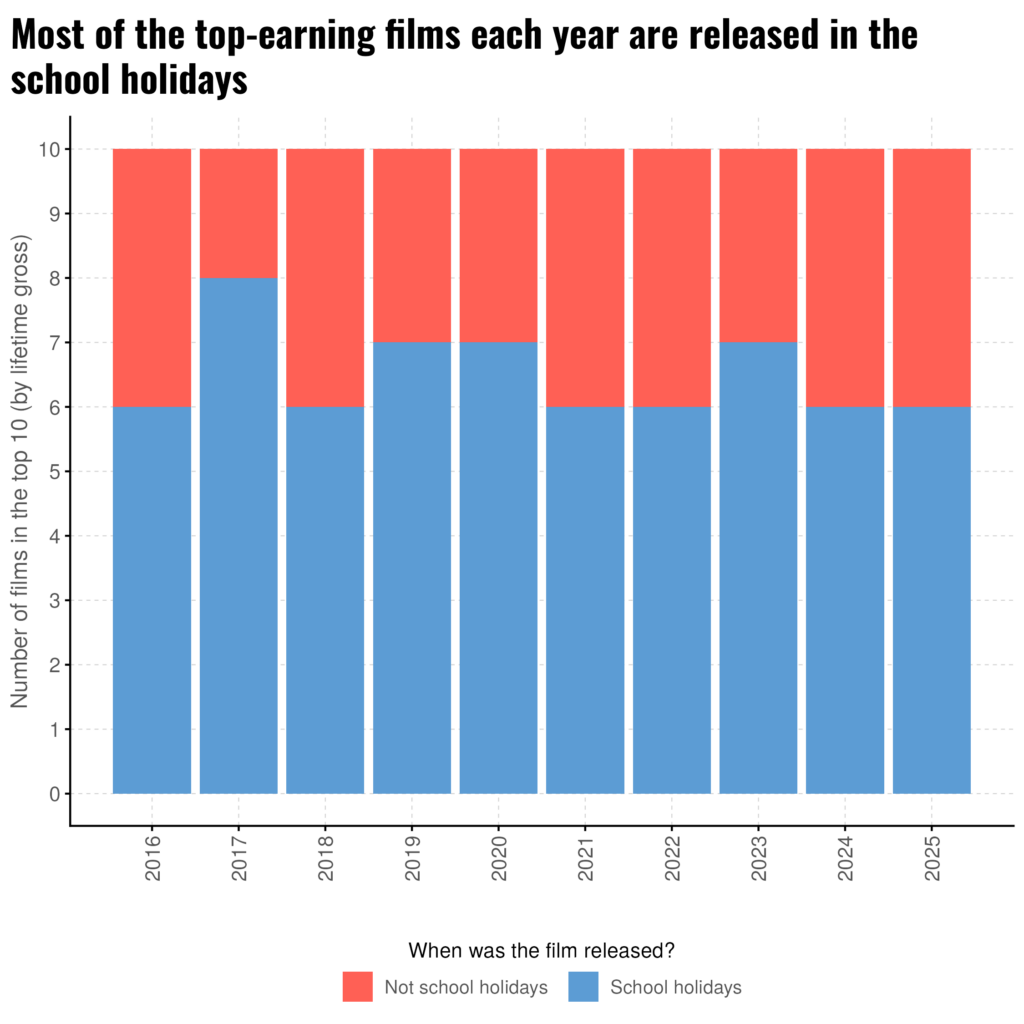
The significance of school holidays suggests that there is an uptick in family groups going to the cinema together, maximising the returns on films releasing at these times. To get a sense of this, we can look at the admissions data instead of looking only at the revenue.
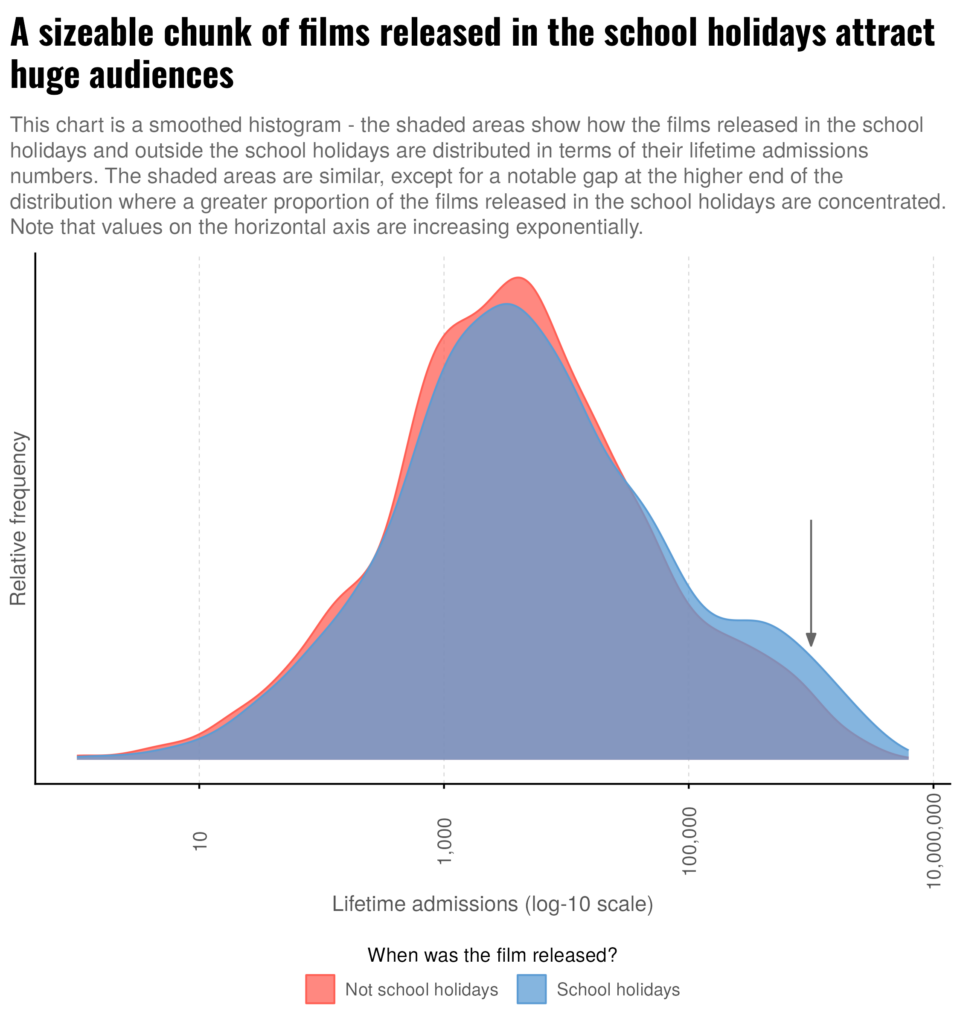
Chart 4 shows how lifetime admissions are distributed for films released in the school holiday windows compared to films released outside the school holiday windows. We can see that the overall pattern is similar, but a bigger share of the films released during the school holidays can be found at the highest end of the scale where the biggest audiences are.
Chart 4
Returning to looking at the release calendar each year, Chart 5 further illustrates the point: the biggest audiences each year tend to be attracted by films released during the school holidays.
Chart 5
The chicken and (chocolate) egg question
All this leaves a couple of questions begging. Is the box-office significance of the school holidays a matter of a readily available audience (children, teenagers, families) or the concentrated availability of big ticket hit films? Or a bit of both? One way to begin answering this question is to examine how films of different ratings (G, PG, M, MA, R) cluster throughout the calendar and to look at the impact of ratings on box office performance. More on that in our next post in the series…