Did Santa deliver for Australian cinemas this past Christmas?
Traditionally, the day after Christmas, Boxing Day, is a “make or break” release date for cinema businesses. We tracked the last 10 years of cinema data and found that this one release week alone made up an average of 3.8% of the national annual box-office earnings over that period (see Chart 8). In 2020 it peaked at 5.4% (thanks to the overall low annual returns resulting from COVID closures), dropping to a rock-bottom 3% in 2024.
As we moved from 2025 into 2026, many film industry commentators expressed concern at global box office returns in 2025, which are still lower than pre-COVID levels. However, in what proved to be the best present ever, Australia ended the year on a high with a welcome boost of Boxing Day cinemagoing.
So just how big a deal is Boxing Day in the Australian cinema calendar, and how has its importance changed over time? Our research shows that, after a significant setback during COVID, Boxing Day earnings are back in the “box” seat but there are interesting new trends emerging in the annual release program.
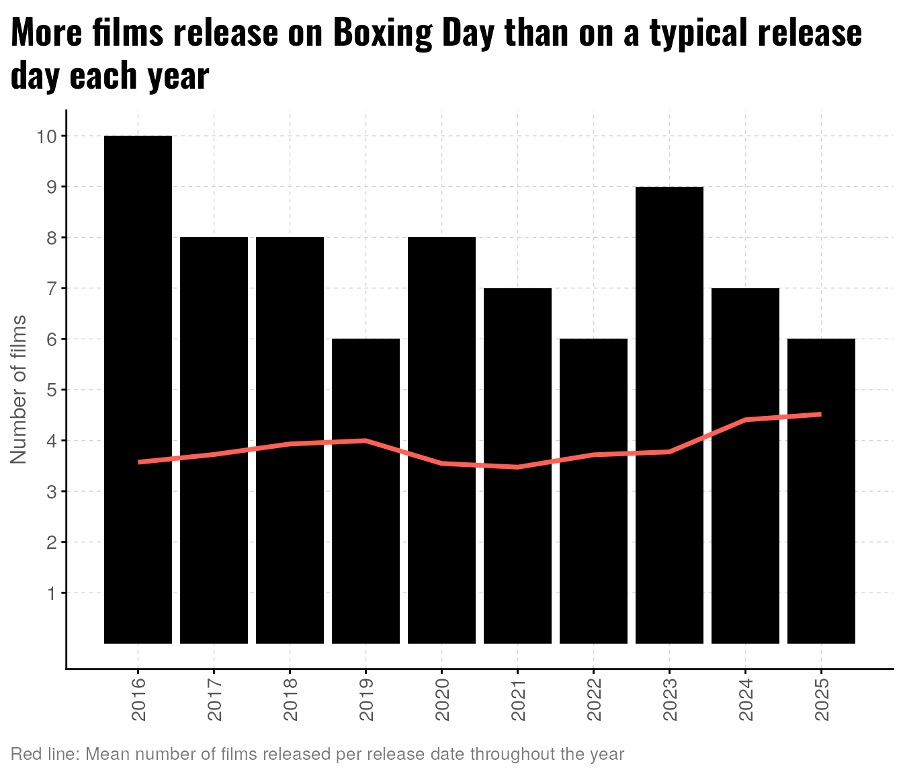
Focusing only on Boxing Day itself, we can see in Chart 1 how the number of films released on December 26th is consistently higher than on a typical release date throughout the rest of the year.
Chart 1
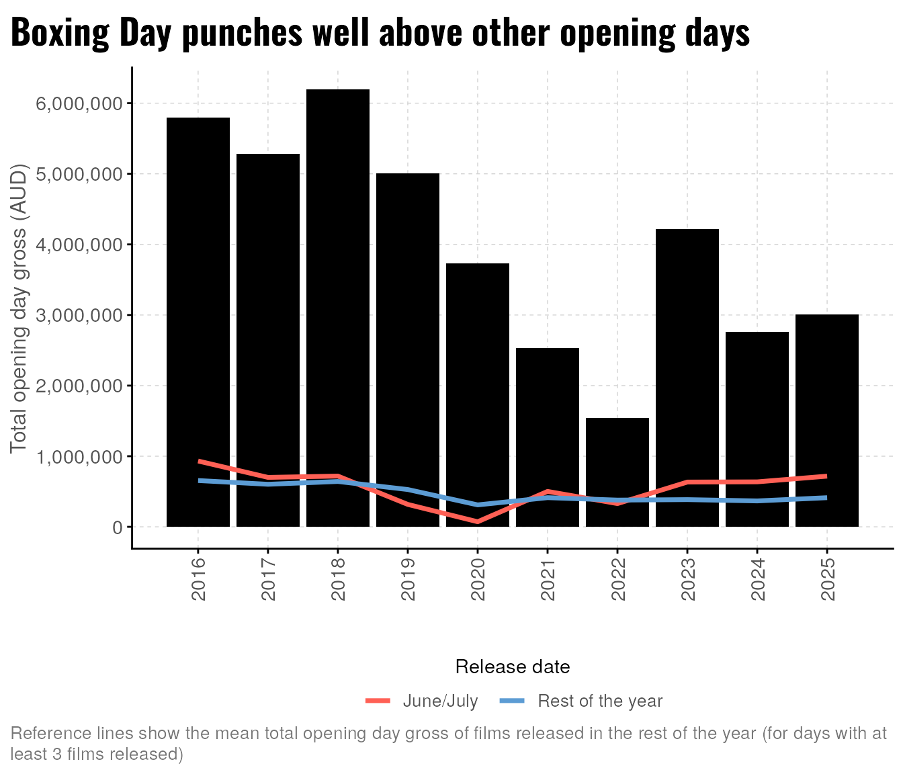
In Chart 2 we can see that the total opening day earnings for films released on Boxing Day (the black columns) declined steadily from 2018 to 2022, but have partly recovered from the COVID downturn in recent years.
Chart 2
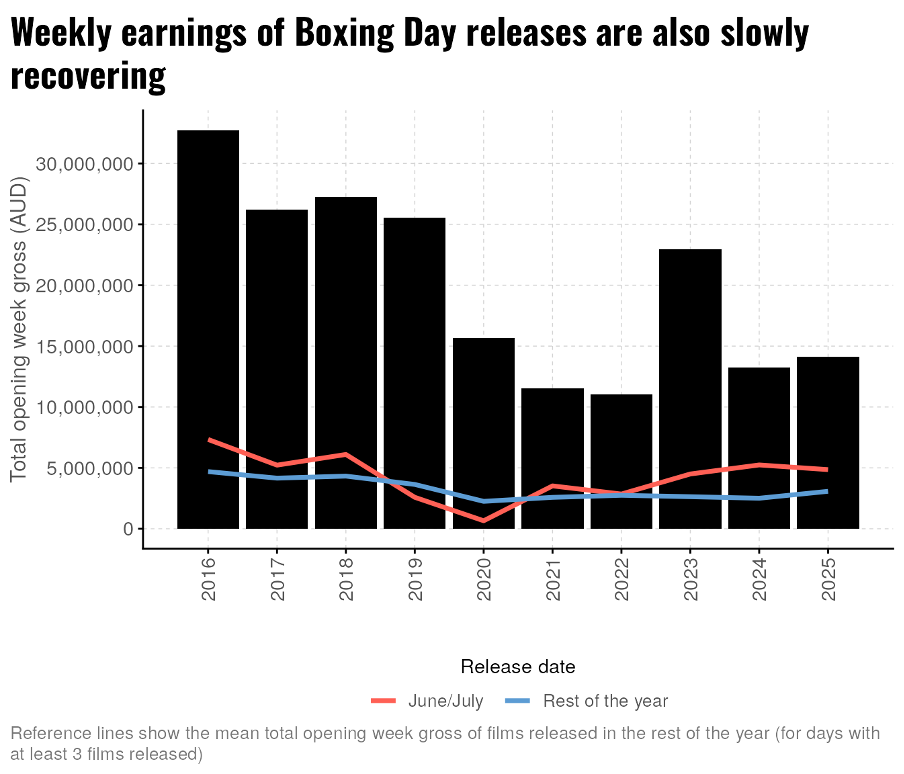
Opening day returns are interesting, but perhaps there’s some natural year-to-year variation to be expected depending on which day of the week Boxing Day falls on. To take a slightly longer view on the performance of Boxing Day releases, we also looked at their opening week returns (Chart 3). And it is possible to see some slight differences but the picture is largely the same. In Chart 3, like Chart 2, we’re looking at a picture where the earnings dropped off during the pandemic and partially rebounded in 2023. As with opening day, the opening week numbers for Boxing Day releases are way ahead of films released on other release dates throughout the year (red and blue reference lines).
Chart 3
If Boxing Day is such a box-office bonanza then why don’t cinemas just release lots of films on this day and reap even higher rewards? After all, we’ve already seen that more films are released on Boxing Day than on other release days, so perhaps it’s to be expected that the total earnings are higher. We can account for the variation in the number of films released if we switch from looking at the sum total of all box office earnings on Boxing Day to looking instead at the average box office earned by each newly released film (the black columns in Charts 4 and 5).
Chart 4
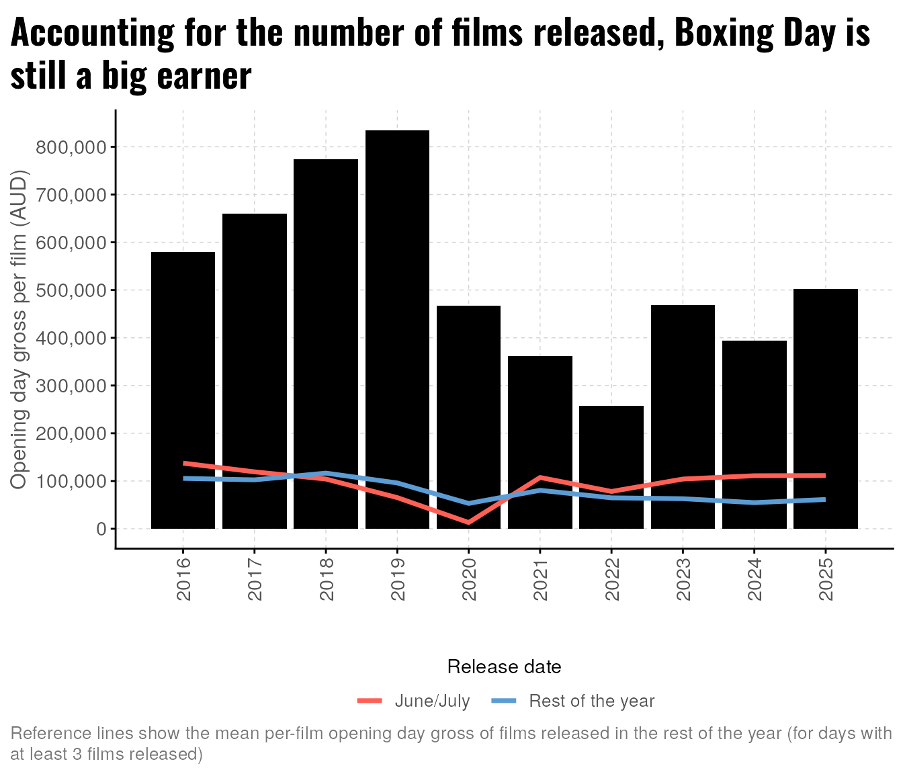
Chart 5
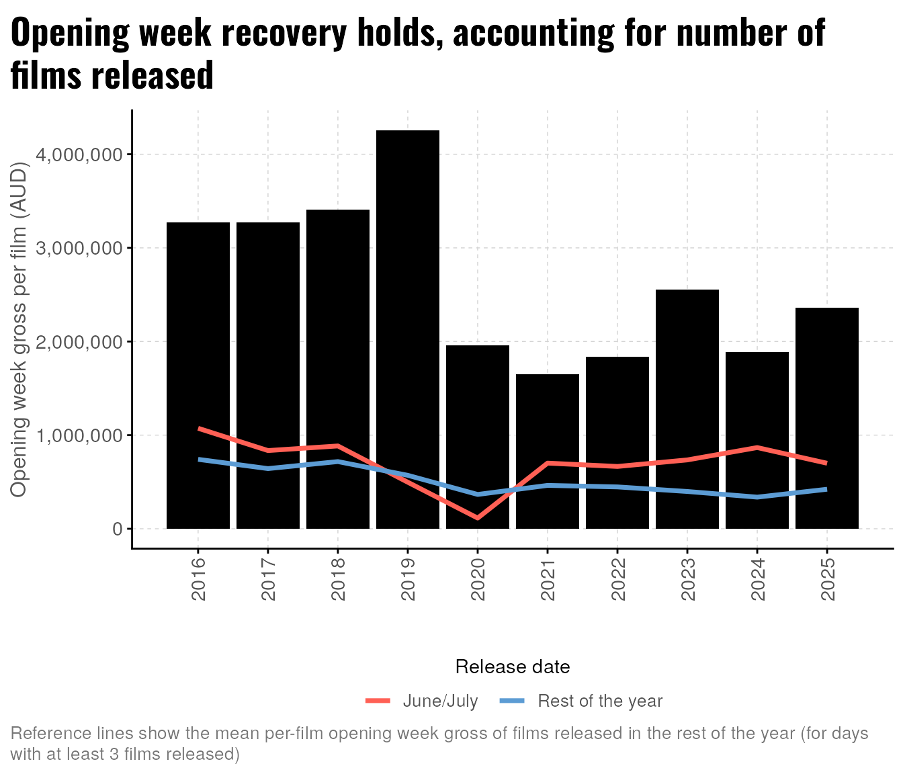
Looking at the per-film figures rather than the sum totals, the pattern only changes slightly and the key point remains: Boxing Day earnings dropped during the pandemic, and have rebounded in recent years but not to pre-pandemic levels. Another thing is clear from these charts: films launched on Boxing Day make a lot more money on that release day and throughout their first week than is typical for releases through the rest of the year (the blue line), including during Hollywood’s Summer (our Winter) blockbuster season of June-July (the red line).
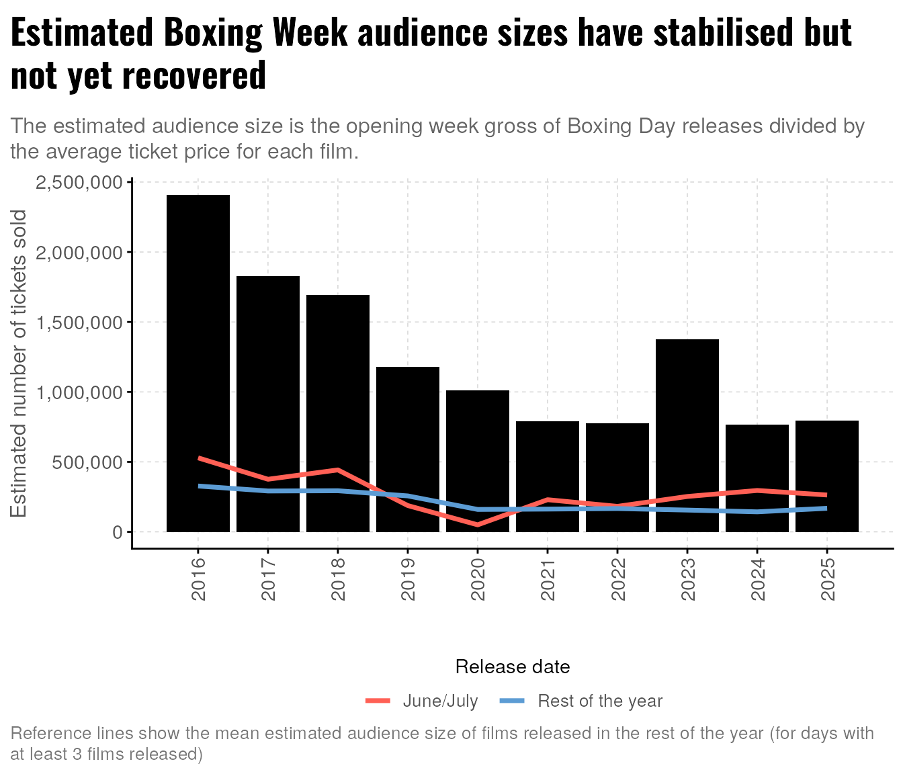
The fact that the box office numbers have started to tick up again since 2021 coincides with a marked rise in ticket prices in Australian cinemas in recent years. So how much is the recovery simply due to Australians being asked to spend more on their festive cinema tickets? We can account for this in the data by looking at the estimated number of tickets sold instead of the gross takings (Chart 6). By this metric, the bounce-back is much less clear, and Boxing Day cinemagoing as a habit appears not to have recovered from the pandemic after all (with the brief exception of 2023).
Chart 6
Is Boxing Day a Gift for Life?
A more direct way of looking at how important Boxing Day releases perform financially in Australia is to look at the total amount of money earned by all movies released in a given year, and calculate the proportion of that money which was earned by films released on Boxing Day.
Chart 7
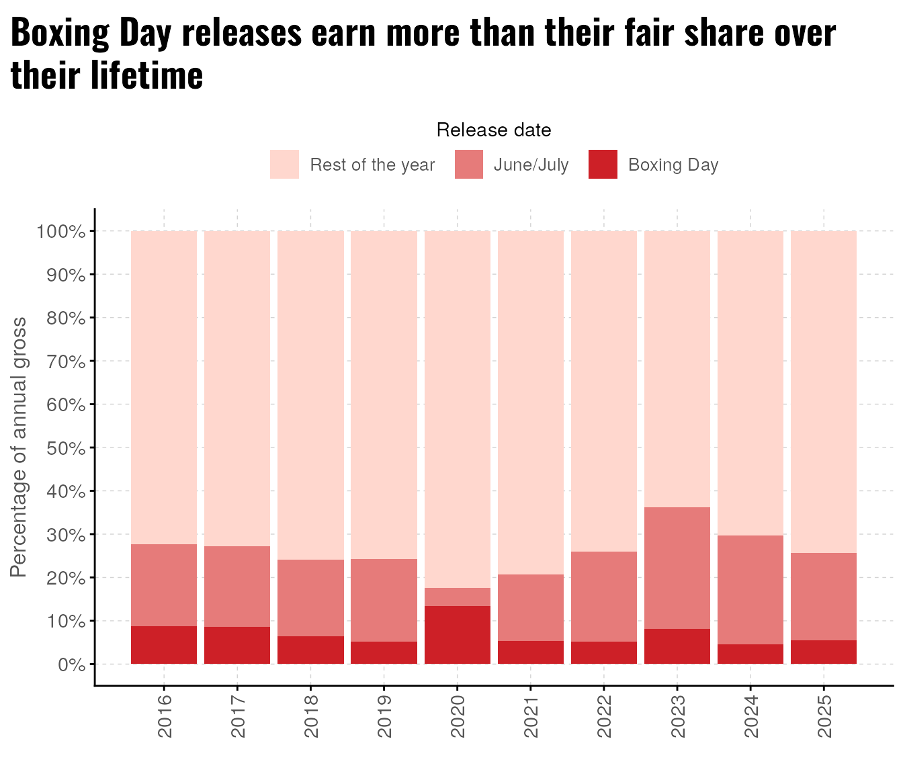
Chart 7 shows that Boxing Day releases consistently account for 5-10% of the lifetime revenue for a given year’s film releases. On average, there are 73 days each year where more than 3 films are released in cinemas. Based on this, a typical release date’s films would account for around 1.4% of the year’s releases’ revenues. Boxing Day releases are clearly punching well above this mark. We can also see in this chart that Boxing Day did some particularly heavy lifting in 2020, a year where COVID lockdowns were in place during the traditional Hollywood summer blockbuster period of May-July, and when Australian cinemas were finally able to open their doors during the December festive period.
To this point, we’ve been focused on Boxing Day releases, but it’s important to remember that films released prior to Boxing Day are still in cinemas on this day and continue to draw audiences and earn substantial ticket sales. In 2025, the top-grossing film on Boxing Day was Avatar: Fire and Ash, which released the week prior, and 4 of the top 8 box office earners were released prior to Boxing Day itself. Chart 8 shows that, in terms of box office earnings taken during the week, Boxing Week remains a reliable and key week in Australian cinemas’ calendars.
Chart 8
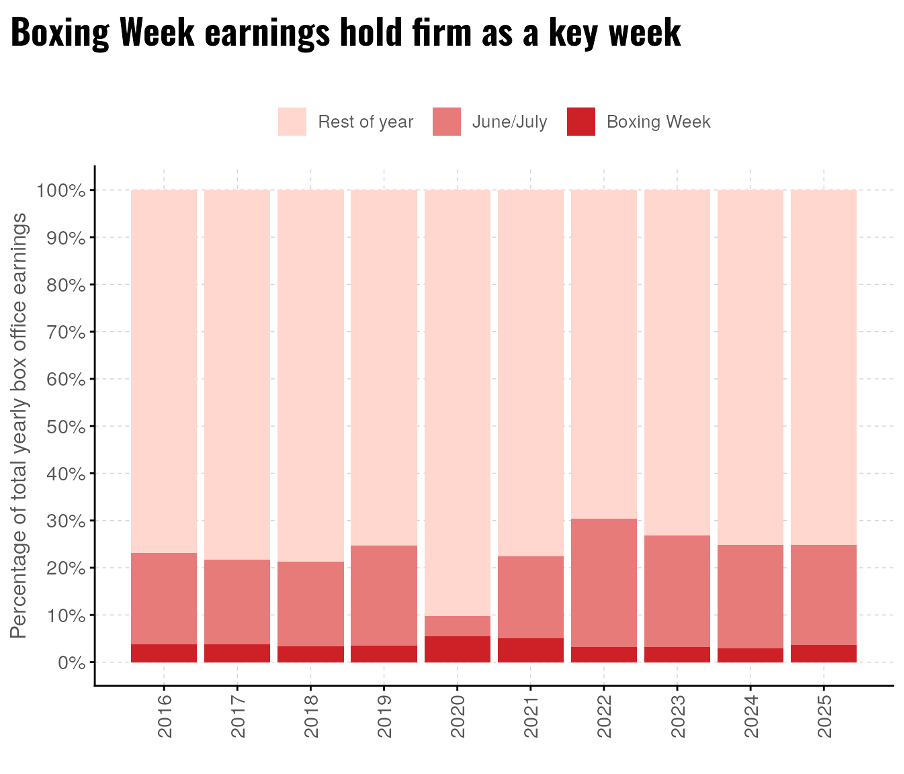
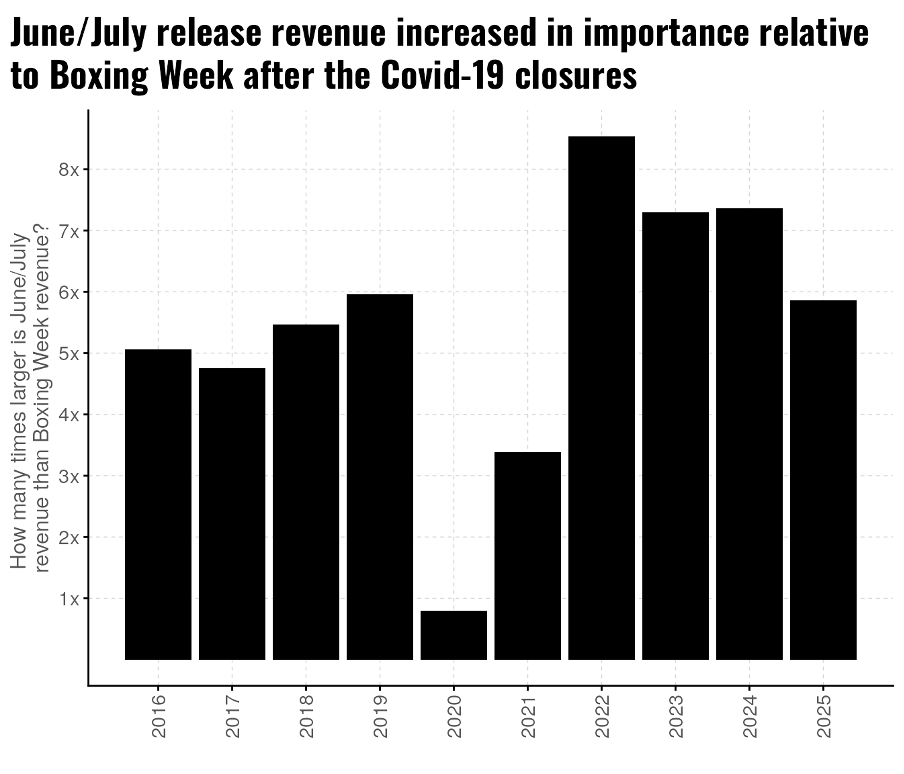
Interestingly, the amount of money made by Boxing Day releases relative to movies that come out in the June-July period seems to be getting wider in recent years, suggesting that the tentpole Hollywood blockbuster releases that cluster in the northern Summers are increasing in their box-office impact compared to the rest of the year’s programming. To answer this, we looked at how many times larger the amount of money earned during June and July is than the amount of money made during Boxing Week. This way we can gauge the relative importance of these two significant release periods in financial terms. This is shown in Chart 9, where we see that the June/July blockbuster period has been taking an even larger share of the pie (pudding?) compared with Boxing Week since cinemas fully reopened after the pandemic.
Chart 9
Stay Tuned!
The shift in commercial significance from Boxing Day to mid-year is a “timely” place to end this kinomatics think piece – we’ll explore the significance of different release dates throughout the year in our next blog post. And after that some thoughts on the impact of classification.