Visualisation – Andy Kirk Workshop
 “When working on a problem, I never think about beauty. I think only how to solve the problem. But when I have finished, if the solution is not beautiful, I know it is wrong” (Richard Buckminster Fuller).
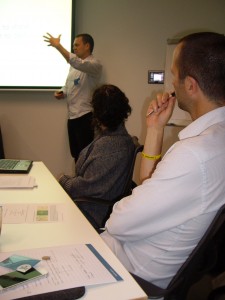
I first heard this quote last week when participating in a workshop presented by Andy Kirk, a data visualisation expert. Andy Kirk’s approach to data visualisation is based not on software and tools, but on the thought and process behind the final products. As a freelance data visualisation design consultant, trainer, author, and founder of visualisingdata.com, Andy’s workshop focused on what goes on behind a visualisation. In his workshop, Andy outlined five steps that need to be fully considered to achieve a successful visualisation:
- Establish the visualisation’s purpose
- Acquire, prepare, and familiarise yourself with, your data
- Determine the editorial focus of your subject matter
- Conceive your design: data representation and presentation
- Construct and complete your design solution
Often, people jump straight in to steps 4 and 5. However, the majority of the work is done in the first few steps. Without a clear understanding of these aspects the final product won’t be as effective or appealing as it could be. There are advantages to exploring different software packages and visualisations; to see what is out there and what could suit your data. But without a clear purpose, intention, or knowledge of your data it is easy to waste time with this exploration.
Another useful aspect of the workshop was Andy’s focus on how to know when you have achieved a good visualisation. There are many guidelines to draw on, and certainly adhering to Andy’s 5 steps will ensure you have a good foundation. For myself, when I’m trying to answer this question, I like to refer back to a definition. The term visualisation has many definitions and is used extensively in different contexts. My preferred definition comes from the area of Exploratory Data Analysis, which defines visualisation as:
“making data and the corresponding phenomena perceptible to the mind or the imagination of the explorer” (Gennady and Natalia Andrienko)
What is notable about this definition is the absence of the word visual. Whilst visualisations create visual access to data, the main focus is on successful communication, or making phenomena perceptible to the senses and therefore comprehensible or ‘perceptible to the mind or the imagination’. The final product of a visualisation needs to both communicate data effectively and be aesthetically pleasing. The two to me go hand in hand.
No comments yet.