The Flow of Film Exhibition
There are two ways of considering the flow of film exhibition: geographically and temporally. The following two visualisations of the film “Anna Karenina” which showed towards the end of 2012 through to mid-2013 illustrates geographic as well as temporal movement.
Geographic
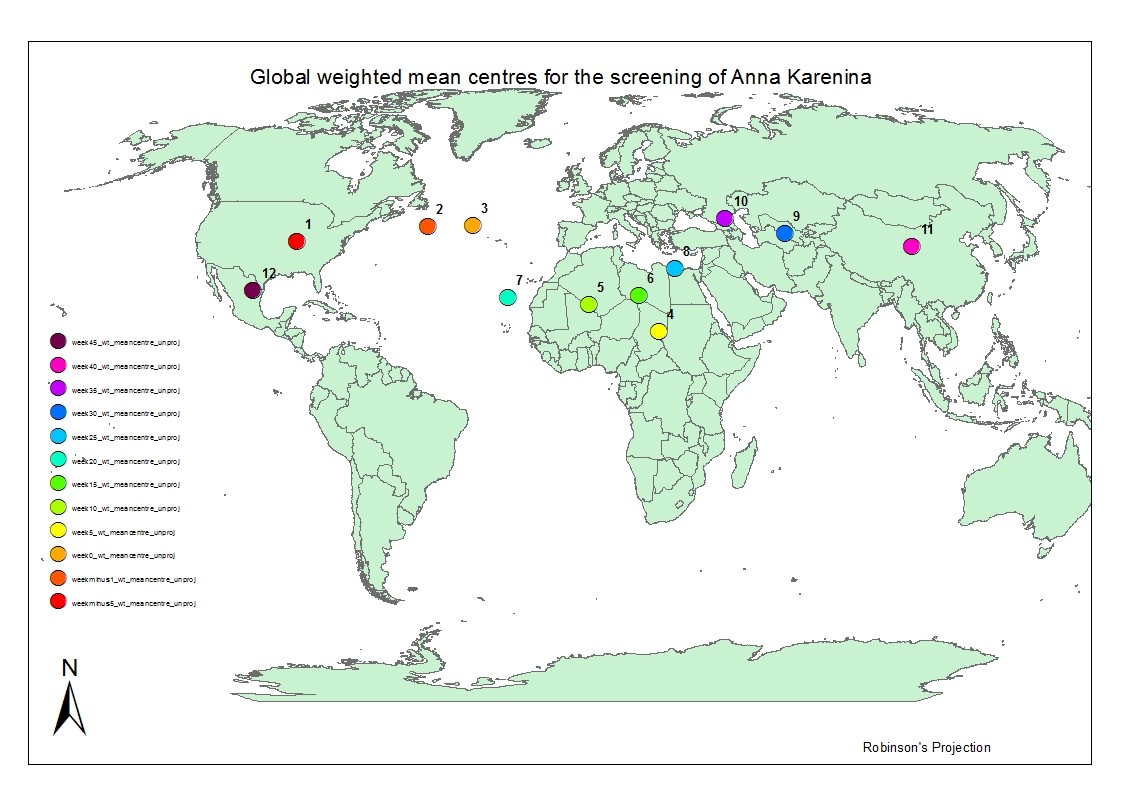 The world map above shows the mean centre of screenings for Anna Karenina for the November 2012 to November 2013 period. Mean centres are calculated by calculating the average latitude and longitude for each of the input features (in this case venues that screened the film). The mean centres were calculated using a weighted mean based on the number of screening at each venue. Note that projected data cannot be used because the origin of each projection would result in difference mean centres.
Chronological dates are for (1) 30 Nov 2012, (2) 31 Dec 2012, (3) 05 Jan 2013, (4) 09 Feb 2013, (5) 16 March 2013, (6) 2 April 2013, (7) 25 May 2013, (8) 28 Jun 2013, (9) 03 Aug 2013, (10) 07 Sep 2013, (11) 12 Oct 2013, and (12) 16 Nov 2013.
Temporal
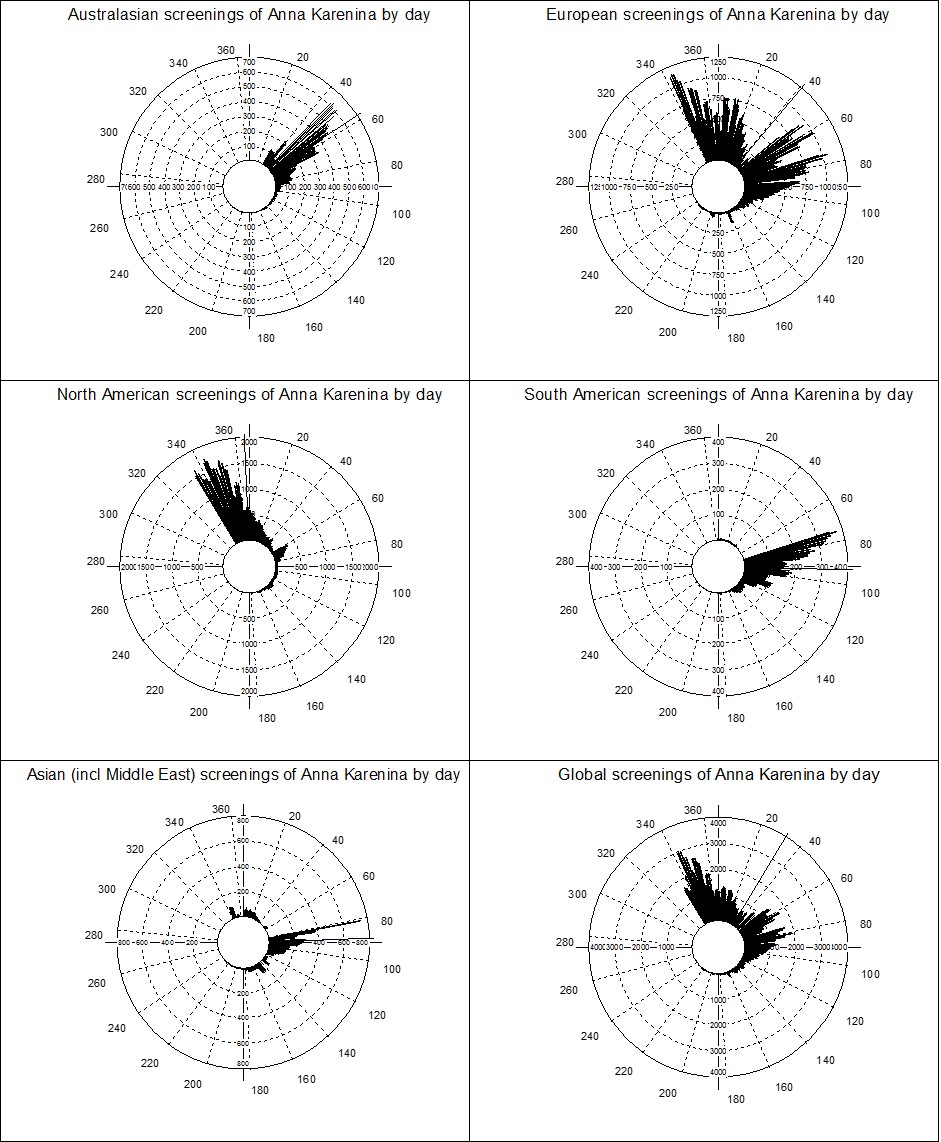 The six plots above have been produced using a package called Oriana. Each of the graphs show numbers of screening for the film Anna Karenina throughout the November 2012 to November 2013 time period. The length of each graph shows the number of screenings and the single black line shows the mean of the screenings. Day one is considered to be January 1st 2013. From the graphs above it can be seen that North American screenings occurred first (in November 2012), whilst mean screenings for Asia occurred more than 80 days later (March 2013).
No comments yet.