Tag Archives: visualisation

Redistributing Gender

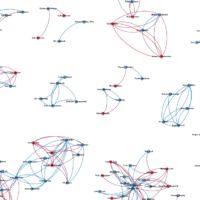
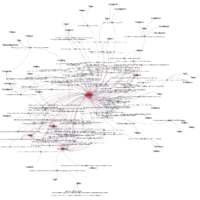
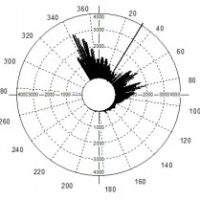
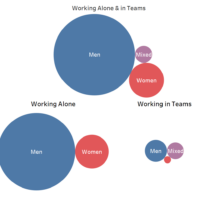
How bad is gender inequality in the global filmindustry? It is much worse than you think. The Kinomatics team have been examining our Showtime Dataset to identify how films directed by women are distributed across the globe. We found that around 15% of new release feature films are directed by women (alone or in teams […]

The “Gender Offender” analysis: How and Why We Did It (Part Two)

Read Part One of this post here. PART 2. Visualising Male Producer Networks This aspect of the project was undertaken by Stuart Palmer. This data on creative roles in films contains within it the information to describe the networked structure of creative team relationships embodied in the film set analysed. Social network analysis (SNA) provides […]

An outline for an intersectional feminist Digital Humanities

In September, Deb traveled to KU Leuven to give the opening keynote at a conference on Intersectionality in the Digital Humanities. Her focus was twofold, asking: What can we learn about intersectionality from working with our data and relatedly, What can we learn from intersectionality to understand our data better The presentation was principally concerned […]

The Flow of Film Exhibition

There are two ways of considering the flow of film exhibition: geographically and temporally.  The following two visualisations of the film “Anna Karenina” which showed towards the end of 2012 through to mid-2013 illustrates geographic as well as temporal movement. Geographic The world map above shows the mean centre of screenings for Anna Karenina for […]